Contents
- Index
- Previous
- Next
FindSites: Informative Sites analysis
We will start here with the final figure from the previous page of the tutorial, on marks:
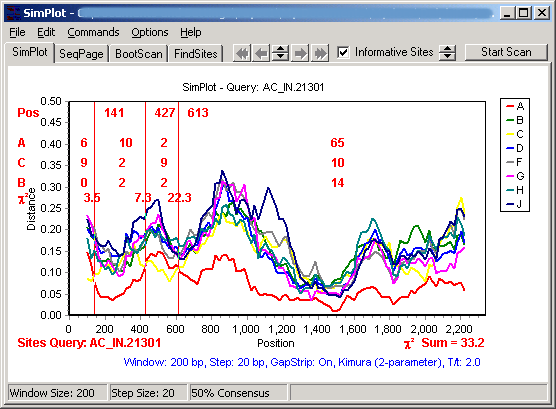
Focusing on the text in red, note the identification of the Sites query sequence (which the user should keep the same as the Plot query, to reduce confusion). Starting from the top of the chart, the first line of red text is the position of the marks. The second, third, and fourth lines provide the number of informative sites (in each segment delimited by a mark) that support clustering of the query sequence with group A, C, and B, respectively. If this is unclear, then I direct you to the excellent paper by Robertson et al.:
Robertson,D.L., Hahn,B.H., and Sharp,P.M. Recombination in AIDS viruses. J Mol Evol 1995;40(3):249-59
which describes the application of the method introduced by Maynard Smith in:
Maynard Smith J. Analyzing the mosaic structure of genes. J Mol Evol. 1992; 34(2):126-9
In SimPlot, this method is perhaps more clear on the FindSites page (the 4th tab in SimPlot):
Input file: C:\Documents and Settings\...
Using the letters A, B, C, and D:
A = AC_IN.21301
B = A
C = C
D = B
There are 3 possible bifurcating trees:
1 2 3
A C A B A B
\___/ \___/ \___/
/ \ / \ / \
B D C D D C
The following sites support the indicated trees:
Total sites: 131
pos A B C D tree#
--- - - - - -----
18 A C A C 2
20 G T G T 2
37 T A T A 2
39 A G A G 2
41 G T G T 2
46 T G T G 2
68 T C T C 2
69 A T A T 2
71 G A G A 2
84 T T C C 1
87 T T A A 1
93 C C T T 1
117 T T A A 1
121 G G A A 1
129 C C T T 1
229 C C G G 1
230 A A T T 1
247 G G A A 1
290 C C A A 1
291 A A G G 1
304 C C T T 1
312 C C T T 1
345 T T A A 1
...[continues]
From this display, it is apparent that the most parsimonious breakpoint would be located between positions 71 and 84. From the information above it is not possible to be more specific than that, and as a general rule, breakpoints should be described as a range of positions, rather than a single position. Now, if we return to the SPlotPage and move the first breakpoint to that location, we see the informative sites results updated as we move the mark, and when it is between 71 and 84 the value of Chi squared (located on the breakpoint marker) has increased from its initial value of 3.5 to 16.1. Even without looking at the FindSites tab, one can move the marks back and forth to optimize the sum of Chi squared (displayed at the bottom-right corner of the chart).
Of course, the user must exercise great care in selecting the number of breakpoints, their locations, and the selection of the two reference sequences and the one other sequence. A discussion of these issues is beyond the scope of this help file.