Contents
- Index
- Previous
- Next
Setting and Manipulating Marks
[the tutorial continues below]
Marks are vertical lines placed on the SPlotPage and BootScan pages, and have a variety of uses:
2 marks can be used to mark an area to be saved as a separate alignment
2 marks can be used to mark an area to generate a Quick Tree or QuickBootstrap
2 marks can be used to set limits on a similarity/difference plot or a bootscan to permit a more focused/detailed analysis without requiring analysis of the entire length of the alignment
Multiple marks can be used to investigate potential recombination breakpoints using informative sites analysis, if FindSites has been set up
Note: For the purposes above, a mark falls just to the right of its nominal position. Therefore, marks at positions 100 and 200 in a 300-residue alignment would delimit 3 segments of 100 residues each.
Creating marks
To create a mark, just double-click (left mouse button) on the chart area, being careful to avoid any points or lines of one of the series on the chart. The location of the mark will be displayed next to the mark itself.
Removing a mark
To remove a mark, double-click on it (without moving the mouse between clicks). If the mark does not disappear but just moves slightly and becomes dashed, then you have moved it (see below), and all you need to do is double click again without moving the mouse and it should disappear.
Moving a mark
To move a mark, there are two options:
Any mark can be moved by double-clicking nearby. "Nearby" depends on the Step Size defined for the plot: "nearby" is defined as less than 2 times the Step Size. Therefore, if the Step Size is 10, then double clicking within 20 residues will move the mark, whereas double-clicking on it will remove the mark (above), and double-clicking farther than 20 residues away will create a new mark (also above).
If a mark is currently displayed as a dashed line, then it is active and the 4 arrows at the top of the chart:
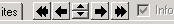
... can be clicked to move the mark left or right (by 1 or 10 residues, depending on which button is clicked). If you want to use this method for a line that is currently solid, then double-click near it to make it active, and then use the arrows to position it.
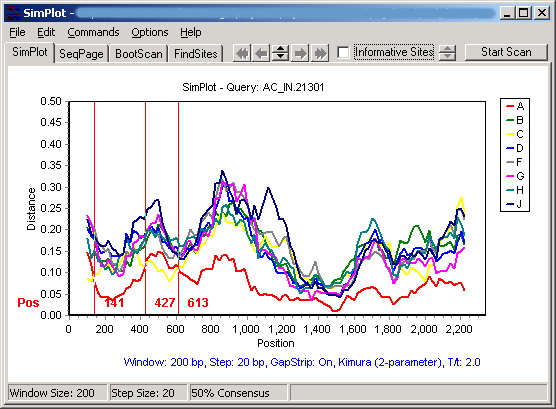
Continuing the tutorial: Starting with the diversity plot from the previous page, we can double-click just above or below each of the three cross-over points of the subtype A and C curves to generate the following:
...and having set up FindSites and moved the Mark Positions and FindSites results to the top of the plot, we obtain the following:
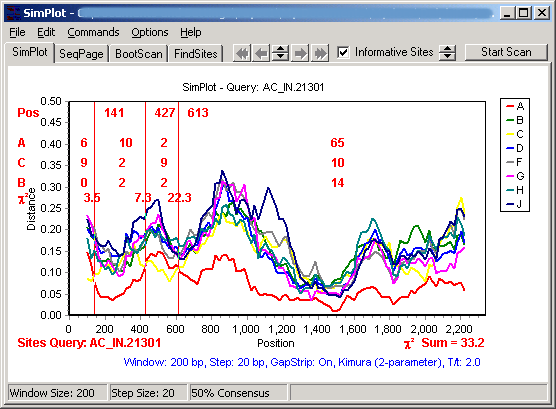
We will discuss what these additions mean, and optimize these breakpoints further in the next few steps.